Friday, June 19, 2015

More of an Art--DSC of Lithium Borate and Cesium Borate Glass

Special Summer Series: Elizabeth Hoover de Galvez from the library's reference department, shares her observations of summer research at Coe. This summer she is working with Dr. Feller's materials science group.
Kristiana, Anthony, and Arron standing behind a differential scanning calorimeter.
They are collaborating on a glass research project this summer.

When Anthony DeCeanne told me about the work that his group is doing this week--measuring and calculating the change in Tg for over 40 samples of glass, I thought it sounded a bit tedious.  This "change in Tg" or ΔTg  (Delta Tg) is at the heart of a recent discovery made in Dr. Feller's lab.  Basically, the ΔTg for borate glasses with small amounts of added elements (Lithium, Sodium, Pottassium, and Cesium) have unexpected differences in ΔTg depending on which element is added to the boron to make the glass.

One of the first steps this group is taking is to go back through data collected by previous students and recalculate ΔTg for various forms of lithium- and cesium- borate glasses using a new method described by a meticulous Japanese scientist, Masao Kodama. 

I observed Anthony going through the process for several hours (as shown in the time-lapse video below) and realized that there is more to it than I first expected.  He looked at many DSC graphs from former years which didn't have the peaks and curves necessary to calculate the change in Tg and realized that the samples would need to be made again and retested.


The whole process isn't at all cut and dried --there are so many things that can go wrong in the process of getting a DSC reading which could skew the results.  Just one example is that the sample can crystallize within the chamber if a certain temperature is exceeded, which forces the students to start over and adjust the range of temperatures tested.  Below is Arron Potter preparing just one sample for testing in the DSC.


Thursday, June 18, 2015

My First Glass Sample

Special Summer Series: Elizabeth Hoover de Galvez from the library's reference department, shares her observations of summer research at Coe. This summer she is working with Dr. Feller's materials science group.
Despite all of my notes from my first days work, when I prepare my own first sample of glass, I make several mistakes and am constantly struck by the fact that doing something is a lot different from watching someone else do the same thing.

First, I forget to measure my sample weight before stirring, which reminds me to double check that I am taking and recording all measurements.  After that, the rest of the recording process goes well, except that I have less time to write the "story" of the process the second time around since I am now busy actually doing the tests.

When it comes time to don heavy gloves and use tongs to set my sample into the furnace, I am extremely nervous.  I'm afraid I'll spill glass into the furnace, burn someone, or otherwise make the physics department regret allowing me in.  The gloves are awkward and they make it difficult to maneuver the tongs, like using left-handed scissors.  Once the glass is cooked, I begin to pour my molten glass onto the plate quencher but I go a bit too slowly and the glowing orange liquid barely makes it out of the crucible before hardening.   Nonetheless, it all works, and once we lift the top plate of the quencher, I am proud to see a perfect unbroken gem of clear glass. 

Then my partner tells me that I'll need to try to break it in half to fit it into our vial.  I attempt to use tweezers to press one side of the glass against the plate and make a clean break.  When that doesn't work, I foolishly pick up the sample in my bare hand.  I don't think I put any pressure on it, but I feel that it still has a bit of heat in it and then it shatters.  Luckily, I'm not cut.

The first test I attempt on my new glass is Raman.  I focus my microscope (not realizing that I am supposed to be attempting to focus on the surface of the glass), and start the laser.  I'm pretty excited to see all of the right peaks on the readout, but my partner points out that the whole thing has a much higher intensity than she would have expected.  I'm curious if this could have something to do with where I focused--somewhere inside the middle of the sample, rather than on the surface.  She makes some adjustments and attempts the next couple of measurements and gets no recognizable peaks.  At one point we see evidence of a cosmic ray pop up on the screen for a brief second.  Finally, we get the expected peaks (except for one extra blip that we can't explain), and move on to the next test.

The DSC test measures the point at which the glass begins to soften as we slowly heat from 50 to 600 degrees Celsius.  The first step is to crush my glass into a powder using a mortar and pestle.  I worry about all of the shards of glass which are managing to escape from the dish as I grind and pulverize and scrape the glass.  Bored with the process, I call it quits before everything has turned into a powder.  I attempt to scoop only the powder and not the remaining shards into my sample dish and then begin the reading.  Though it takes about 15 minutes to run the test, I watch the readout the whole time, hoping that I get the correct result.  But no such luck--something has gone wrong again which causes my graph to make a strange dip prior to climbing.  I blame myself, assuming I somehow got a too large chunk of glass into the sample which messed things up.  The student who has been training everyone on the DSC instrument thinks it may be something else.  I decide that I will have to rerun the test, and since I've already cleaned up and disposed of my glass powder, I will have to start from scratch.  Ugh.  

Despite running out of time before I can get a density measurement on the pycnometer, I feel good about the morning's work.    


Intro to the lab

Special Summer Series: Elizabeth Hoover de Galvez from the library's reference department, shares her observations of summer research at Coe. This summer she is working with Dr. Feller's materials science group.
For all of Dr. Feller's materials science students, the first week's activity was to make a sample of glass (.4 Sodium Borate) and then run three tests on it (Raman spectrography to get the molecular structure, DSC to get the glass transition temperature, or Tg, which is the point at which the glass begins to soften, and Pycnometer for a density measurement).  Even if the first sample turns out perfectly, Dr. Feller says that students should then make the sample a second time and then a third.  My lab partner, who has a lot of experience in the lab rolls her eyes; she has apparently made this glass too many times before and wants to get back to making a more useful sample.  But for me it sounds like a great opportunity to see what making glass is all about and then to get comfortable with the procedures.

The first day, I watch my lab partner go through the steps, which gives me plenty of opportunity to take copious notes.  Dr. Feller stresses the importance of a thorough lab notebook. He wants the story of the experiments recorded, including all of the procedures, errors, and unexpected results.  He warns his students that if they don't write it all down, then when it comes time to write a paper for publication or to replicate the experiment, perhaps months or years later, everyone will be lost.  

While making and testing the first sample, I am surprised by how comfortable I feel with many aspects of the procedure.  We start out using Google Sheets to calculate the recipe for our glass; since I love tinkering with Excel, (and because my lab partner knows exactly what she's doing), I don't feel at all as intimidated by this first step as I thought I would.  When it comes time to actually measure out the ingredients on the scale, the process is familiar from my college chemistry labs.  While the 1000 degree C (1800 degrees F) glowing orange furnaces are enough to scare anyone, I am relieved that there are at least no open flames.  And when we open up the Raman spectroscopy machine to put
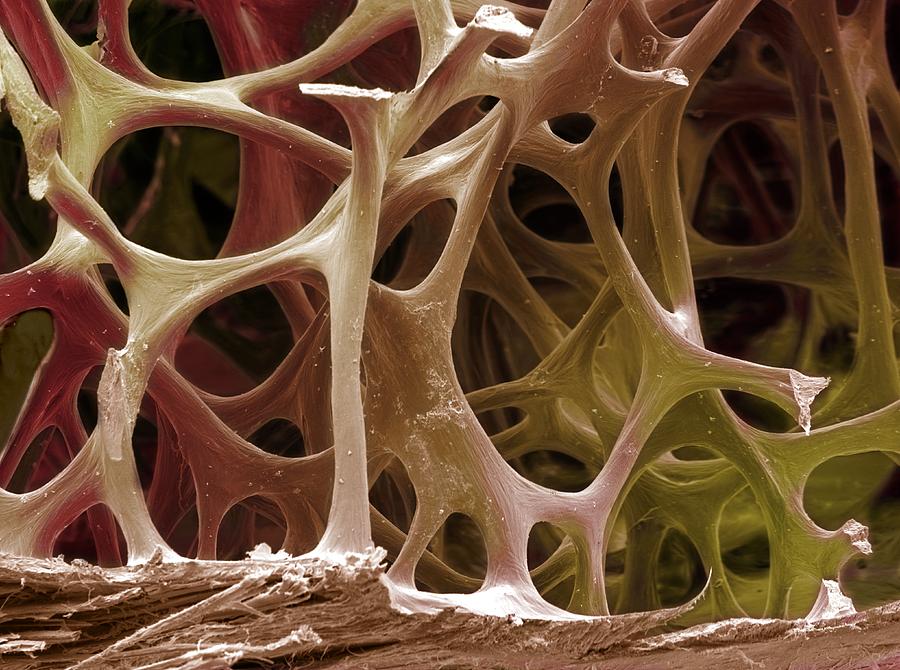
Bird bone tissue. Coloured scanning electron 
micrograph (SEM) of spongy bone from a robin. 
By Steve Gschmeissner.
our sample in the first time, I am delighted to see a microscope, which is one piece of lab equipment I got very comfortable with in my college biology lab classes.  The sample of glass under 10x magnification even looks like bone tissue to me, a gorgeous network of transparent blue struts, similar to the photo at left.  Rather than feeling completely alienated, I feel fairly at home in this high-tech, multi-million dollar physics lab.

In addition to some familiar equipment, all of the people in the lab--both students and Doctor Feller--put me at ease.  They are extremely welcoming, excited to be working there, and happy to share their passions with a novice.  Doctor Feller remembers to point out the physics concepts in basic terms for me and I think I can remember some of the concepts from my introductory level science classes.

All in all, the first day nerves get squelched very quickly and I immediately start learning much faster than I would from a book or article.  On my way out on my first day, I pass a student poster hanging in the hall and stop to read it.  Rather than being confused by the terminology and descriptions of the procedure, I quickly grasp the basics. 


Shards of Glass and Extreme Temperatures

Special Summer Series: Elizabeth Hoover de Galvez from the library's reference department, shares her observations of summer research at Coe. This summer she is working with Dr. Feller's materials science group.
The physics labs on campus are a foreign world where multiple furnaces glow orange at 1800 degrees Fahrenheit, glass is crushed into a powder with shards flying, and liquid nitrogen is pumped from large tanks into instruments where air won't suffice.  It's a place where cosmic rays become visible as sudden peaks on a graph and an electron microscope provides a window to the unimagined textures and structures of the nano-world.

Raman spectrum from a sample of .4 Sodium Borate glass.
The peaks at 771 cm-1 and 498 cm-1 are due, respectively, to the
"breathing" and back and forth vibrations
of the 3,4 coordinated rings.  The hump at 1385 cm-1 is due
to the vibrations of non-bridging oxygens.
Whatever that all means...
To me, it sounds fairly poetic to imagine a molecule breathing, but that is exactly how Dr. Feller describes the structural vibrations of one type of glass, which is apparently evident from the spectrum shown at right.  He explains how the Raman spectroscopy works.  First the machine sends out a laser beam which hits the glass and spreads out over the surface.  Don't quote me on this, but I believe the laser itself is responsible for exciting the molecules so they start vibrating in a new way, as does the beam of laser light.  All of these vibrations, though, are constrained by the structure of the molecules, so the location, height, and steepness of the peaks in the resulting spectrum graph provide clues to the molecules structure.

After skimming through the Wikipedia entries on Raman, spectroscopy, and inelastic scattering, I'm still fairly confused about how all this works...just as I was over 10 years ago when I initially learned about spectroscopy.  But the students don't seem confused--at the first meeting, they were conjecturing about the reasons for the locations of the peaks and asking questions about the slope of the peaks, which seemed to impress Dr. Feller quite a bit.  It's nice to be the outsider who isn't expected to understand everything...far more enjoyable that way.  


Wednesday, June 10, 2015

Materials Science: 2015 Summer Projects

Special Summer Series: Elizabeth Hoover de Galvez from the library's reference department, shares her observations of summer research at Coe. This summer she is working with Dr. Feller's materials science group.
The Research Experiences for Undergraduates (REU) program kicked off this Monday at Coe with a total of 38 undergraduate students participating across seven working groups.  There is a mix of Coe students participating, from beginners to experienced researchers, along with students from other colleges and universities around the country.  I joined Dr. Feller's research group in materials science with 10 students and he and the students have been extremely welcoming and have allowed me to get hands-on experience with the lab equipment over the past couple of days.

For week 1, the students started with a deep cleaning of the lab.  On Tuesday afternoon, Dr. Feller announced the projects that students can work on over the summer and gave his students an opportunity to choose which ones they may be interested in.

Of the eight projects available, at least four will include some collaboration with other universities around the world.  For example, three groups will be making samples of glass which will be shipped to other universities for further research and analysis.  One bonus of these collaborative projects is that students may eventually be invited to travel to these other sites; in fact, one student will be going to England for a second time this summer to work with the researchers who've been using the glass she's made.

Two of the projects are related to a new discovery which was recently made at Coe.  The discovery was an unexpected difference in the way in which two related glasses softened when heated.  Students will continue investigating the phenomenon and work to test a hypothesis which seeks to explain it.

One interesting new project this year will analyze elements present in pennies minted during WWII, particularly 1944 & 1945.  During the war copper was needed for the war effort and so the mint briefly made pennies from steel and then, in 1944, began reusing copper shell casings to make pennies.  Dr. Feller said this would be the first research to analyze and characterize the pennies from 1944 & 1945 to look for unique elements or distinguishing characteristics within the pennies.  They won't have to destroy the pennies to analyze the elements--they'll use the chemistry departments new XRF (X-Ray Fluorescence) spectrometer gun, which provides a readout of all elements, including trace elements, present in an object.